Line25 is reader supported. At no cost to you a commission from sponsors may be earned when a purchase is made via links on the site. Learn more
Designers require using a timeline infographic quite often for their clients and these types of infographics are integral to business literature, whether it be coffee table books, annual reports, PowerPoint presentations, or website content. Also, many of us are pretty familiar with the trend of businesses adding a timeline of their business, located on their official about us website page.
Moreover, data journalism is currently in the trend, which means media agencies take large pieces of information, analyze it and present filtered data sets in the form of infographics. It saves the reader time and makes complex information easy to understand.
For example, editors brief their writers to prepare chronological historical events of an issue instead of writing lengthy articles on it. Hence, designers have to use creative graphics to present such data frequently. And they largely depend on free timeline infographic resources because of time constraints such as deadlines.
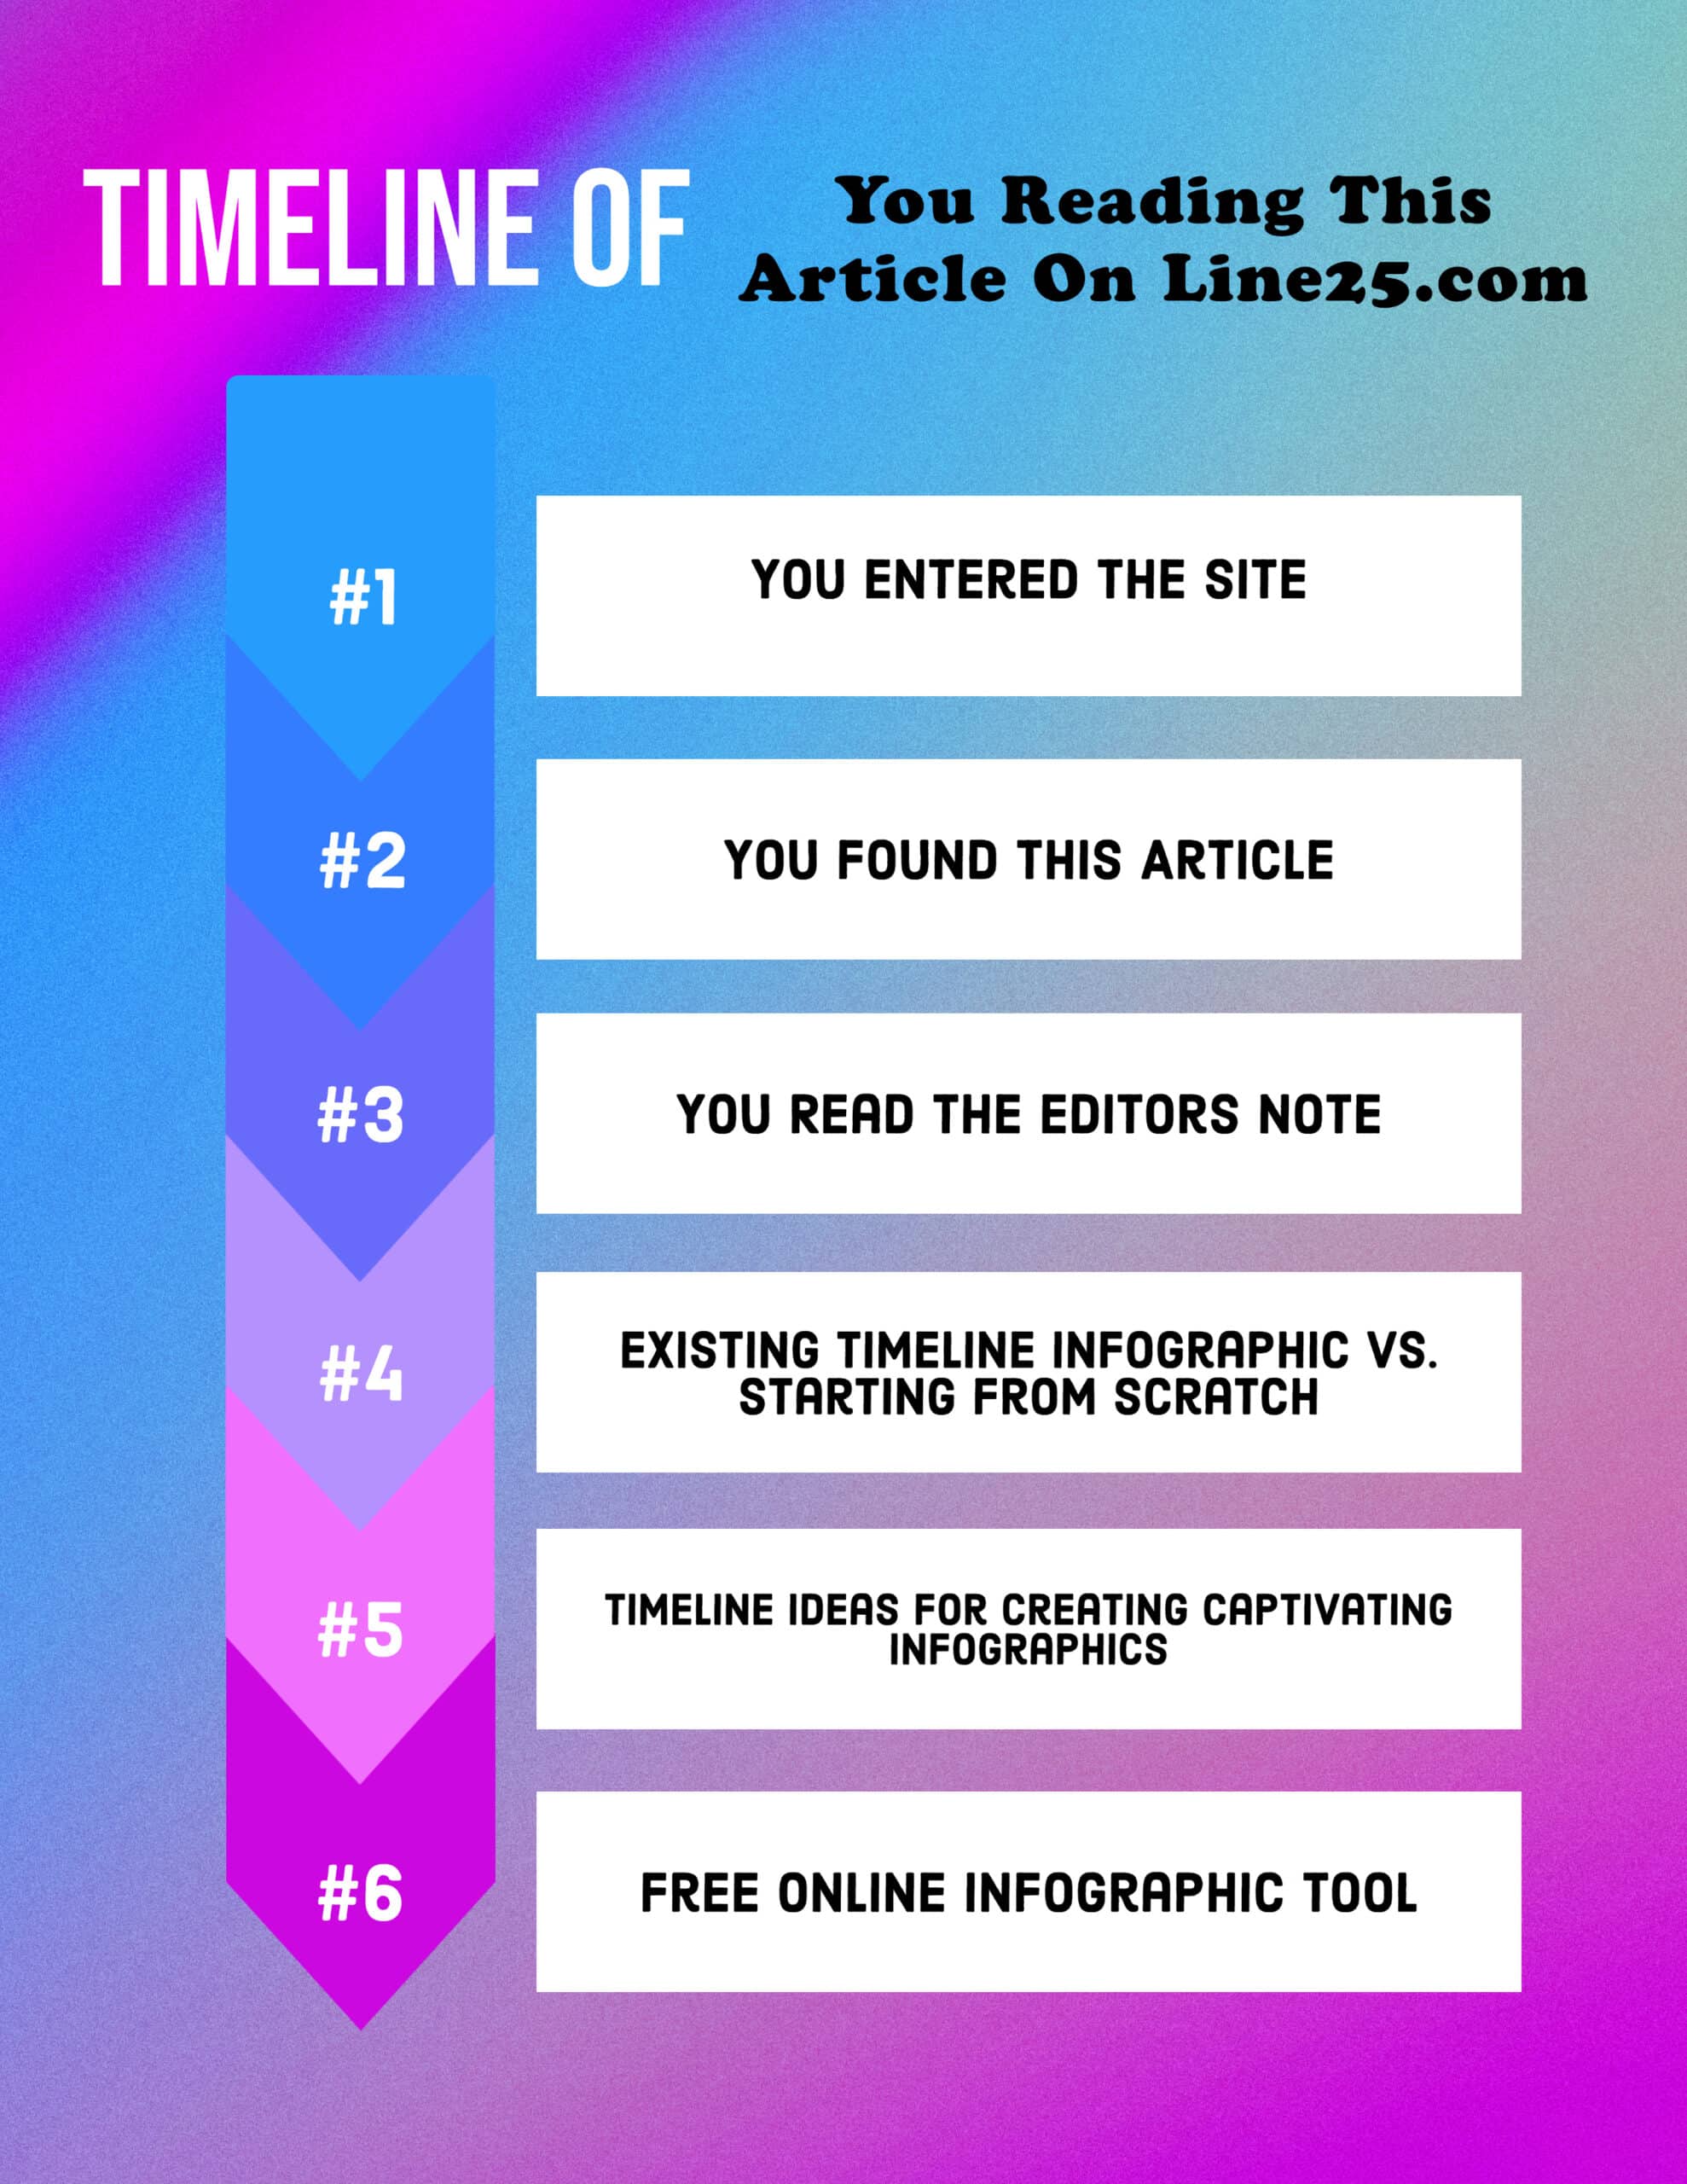
Editors Note
Would you like a free tool to create any type of Amazing looking infographic?
Continue reading and the details will follow shortly.
These resources are required in conventional mediums and on various social media platforms such as Facebook, Twitter, Instagram, and many others. In today’s ‘glimpse and scroll’ system, marketers have very little time to share their messages. Therefore, infographics are a popular image asset for exchanging information on such platforms.
Consequently, the need for extensive, attractive yet free timeline infographics is highly demanded in the designing community. But it can be somewhat taxing to find a unique, quality design in a concentrated group of infographics online, which is the reason for this blog post and a solution to that frustration.
15 Best Timeline Infographic Examples
These beautiful infographics are completely free and/or may require a trial subscription. No matter what, you can keep the image if you continue the subscription or not. Here are the platforms providing these free timeline infographics: Adobe Stock – Shutterstock – Vecteezy
1. Business Infographics Timeline Template
Suppose you are looking for a timeline infographic template to present the business roadmap to the board members and the rest of your company’s stakeholders. In that case, you can use the above-posted specimen for your purpose.
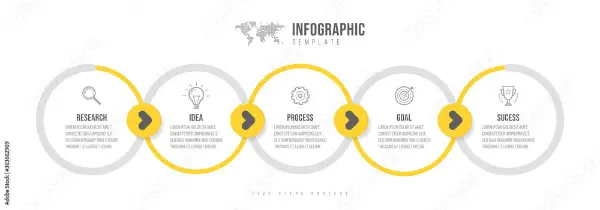
It looks minimalistic and sleek. This template’s minimum colors make your reader focus more on the textual part, which holds significance. Each step of your planning will be presented in a circle that draws attention to the textual content, and the yellow line on the circle denotes the forward flow of the process that looks promising. Additionally, yellow denotes progress, and grey denotes neutrality and balance, perfect for such topics. Lastly, each stage in the template has a relevant vector icon to create attention to detail.
2. Presenting Project Timelines
Project timelines are essential. They are pivotal to keeping track of time for each project. A project manager develops a visual list of tasks to be accomplished in each project phase. A project timeline consists of tasks and the start-end date of each. Hence, they are pivotal for the company to keep track of time, money, and resources invested in each phase.
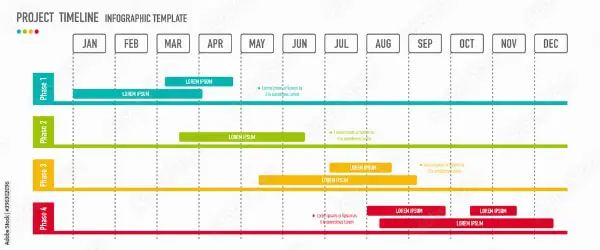
Understanding this, designers can create a project timelines infographic as above. It is subtle and keeps off the clutter. Sans serif fonts with tall x-height look legible and similar to calenders. In addition, the use of four different colors for each phase stands out, making it easier to focus on the detail one requires at a time.
3. Business Infographic for Company Milestones
Each time an organization accomplishes an important task, it becomes an achievement, and such achievements are pivotal for its growth and success. Each accomplishment becomes a milestone to be celebrated and cherished. It should be registered in the company’s literature.
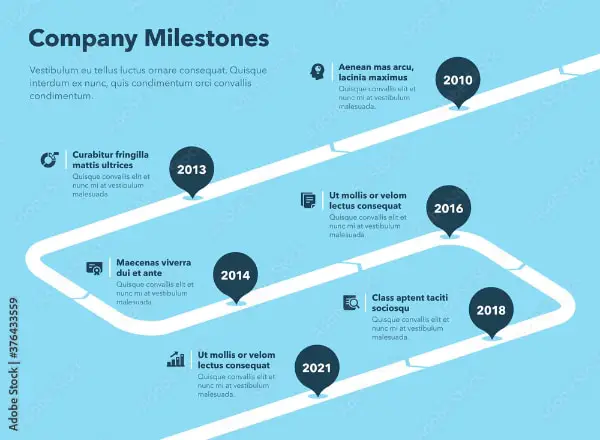
Designers tasked to prepare a unique timeline of the company’s milestones can check out this monochromatic theme design which is unique. The white line that breaks in arrows shows a forward path, and the pointers in dark blue signify milestone years. In addition, you can add a heading to each milestone in the textual part beside each dark blue pointer with a heading and a short description of your achievement. Also, a vector graphic added along with the space for textual content gives a visual description of the text.
4. Infographic Chart for Showing Security Measures
Designers can take inspiration from the above stock image of the timeline regarding security measures. Such timelines are often a broad visual manual of steps to be followed at a particular place or event.
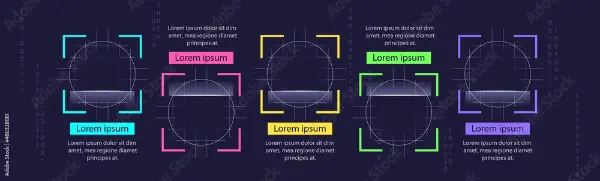
Designers can take inspiration from this stock image that has used scanning elements. Quite clever! An intelligent way to make people aware of the topic visually. Moreover, each element has a different color which signifies that each step is different. Therefore, designers can add instructions below and above each square. Moreover, a dark blue background finishes the look.
5. Timeline of Consumer Behavior
Designers can use this stock image to portray different stages of consumer behavior. Shades of blue change from dark to light to denote the progression towards the next stage. Each arrow has textual content and vector graphics both inside it. Hence, the outside space looks clean, leaving considerable breathing space around the timeline.
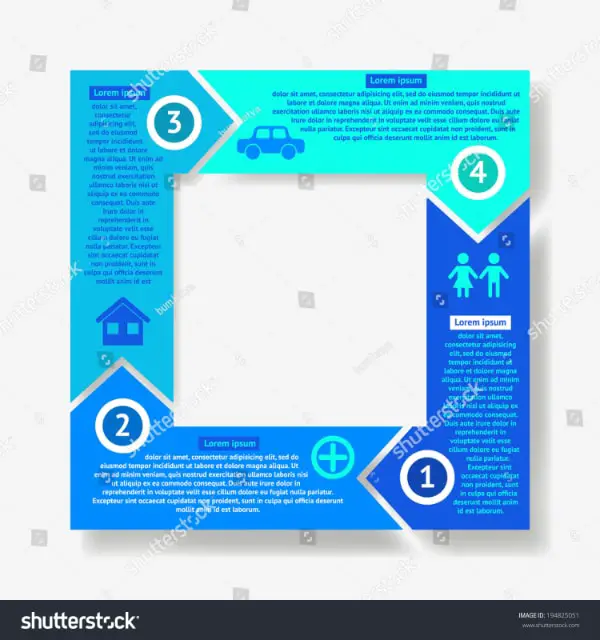
Moreover, Each stage is numbered to avoid any confusion because of its circular motion. Finally, shades of a single color maintain the subject’s uniformity, denoting the topic stage by stage.
6. A timeline of Global Business Affairs Infographic
Designers can present a timeline of international treaties, agreements, or practically anything with this beautiful and professional stock infographic image. This is a timeline infographic that consists of a globe making it more relevant.
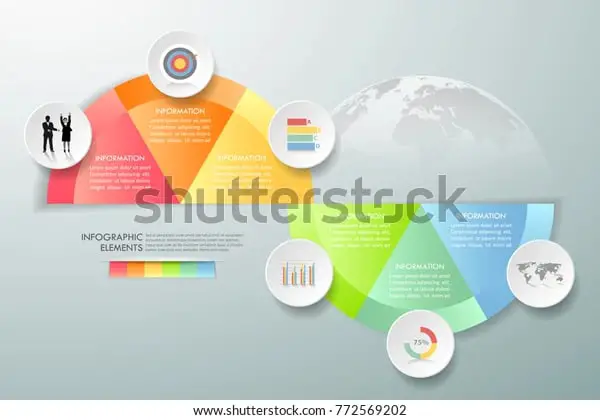
Gradient colors contain data chunks. Designers can use relevant vector graphics representing the theme of that year’s meeting. Fonts in white color stand out on the colorful background, making it more legible. Such formal-looking and modest timeline infographics work well for governmental organizations.
7. Free Medical Timeline Infographic With Stethoscope
Designers can use this type of timeline infographics template for healthcare providers. The use of a stethoscope for the timeline is innovative and symbolic. Taking inspiration from this template, designers can experiment with other healthcare vector elements for their timeline. Also, vector graphics of different types of medical equipment can be positioned as icons in those circles for visual guidance.
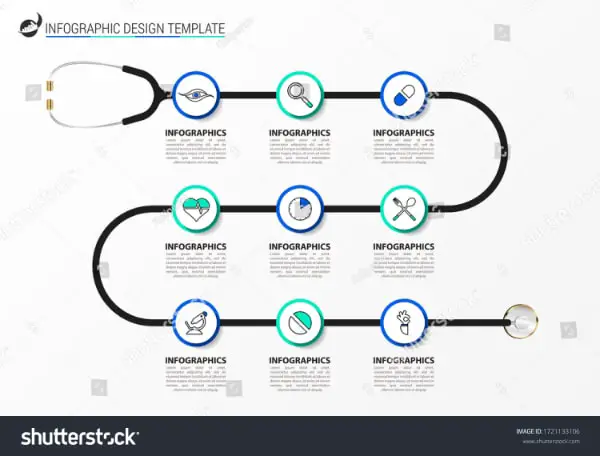
Further, the designer can take sea green, and blue colors formally used to denote medical facilities. Bold Ariel fonts in the upper case are readable and straightforward, whereas the body text reads well.
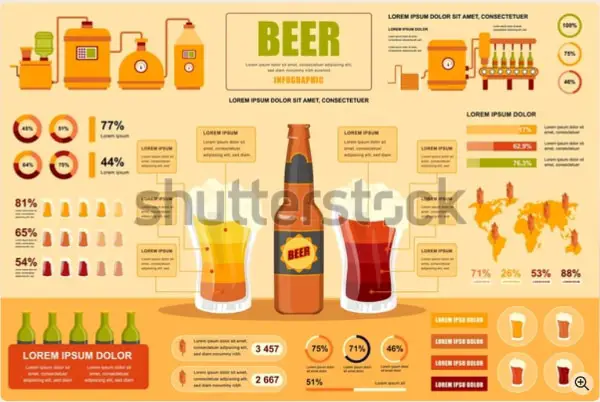
8. Beverage & Beer Related Timeline Infographic
Designers can present industry-specific analysis on the timeline infographics. However, industry analysis can be clumsy and taxing; designers can take industry-specific vector elements to segregate such data. For instance, the designer presented data in different shades of beer flavors to show beer-industry-related data in the above stock image.
9. An Online Delivery Process Infographic
Various companies run online delivery businesses; various independent service providers handle the logistics. Accordingly, each service provider has its market share. Therefore, while preparing timeline infographics on this subject, character-specific vector graphics can represent each stage.
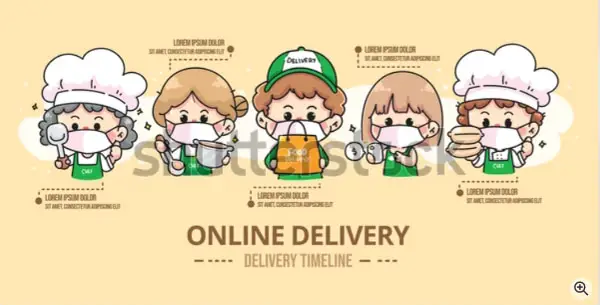
For instance, in the above stock footage of an online food delivery timeline, people responsible are taken to describe each stage. Each vector character in the image looks cute and distinctive. Also, the font color in this image is coffee brown and not the conventional black or white fonts. Coffee brown fonts complement the cream-colored background. Designers can experiment with making such cute timelines for logistics providers.
10. Timeline Infographic for A Travel Itinerary
Travel agencies that provide travel packages require to prepare attractive travel itineraries. Designers can use bright colors and tempting vector elements that attract eyeballs to your design.
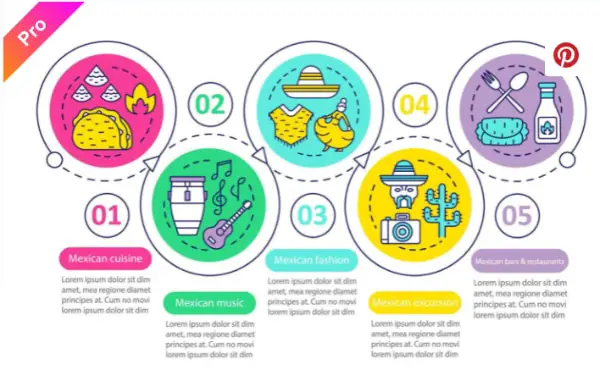
The stock image timeline infographic has electric pink, grass green, sea green, yellow and purple to create a fun vibe. All of these elements are connected with a line encircling each. The line has arrows at fixed intervals representing an airplane that begins its journey from start to finish. Graphics designers can take inspiration from this and creatively put traveling elements to create a timeline.
11. Infographic for Promotion and Marketing Plans
Designers often have to prepare timelines for the brand’s marketing and promotions strategies. The timeline infographic above has a yellow and purple-themed template. In addition, it has vector elements in round shapes and titles in cylindrical shapes and centrally-aligned text below it. Elements inside the circle are significant and are connected with dots that look good.
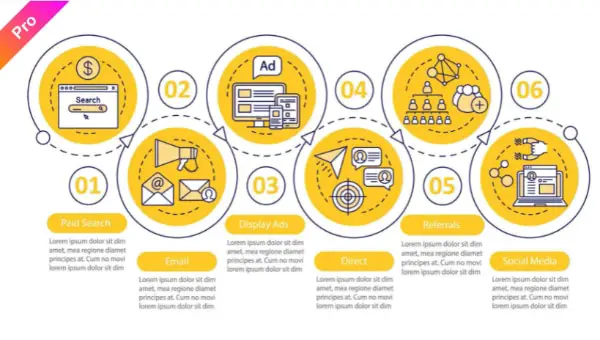
Thus, vectors look large, and text looks compact. Hence, everything in this template creates a perfect symphony together. Designers can design a timeline using large vectors that directly justify the title of the stage and put text in small fonts below it.
12. Evolution Timeline of Architecture Infographics
This segment is quite a tricky one as it requires an endless amount of creativity in it. But designers can take an easy way out in this. Search for relevant vector graphics for each era or time frame and put them on the straight line as shown in the stock image.
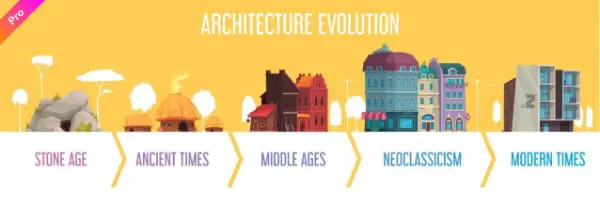
If there is no description required for your timeline, then you can simply put colorful vector designs on a bright background such as in this picture, or you can elevate your timeline and put your body text below each title. You can resize each object to fit your design.
13. Evolution of Current Event or News With Real Photos
This image will work well for a news and current affairs segment. Such timelines can have photographs of events rather than vector illustrations.
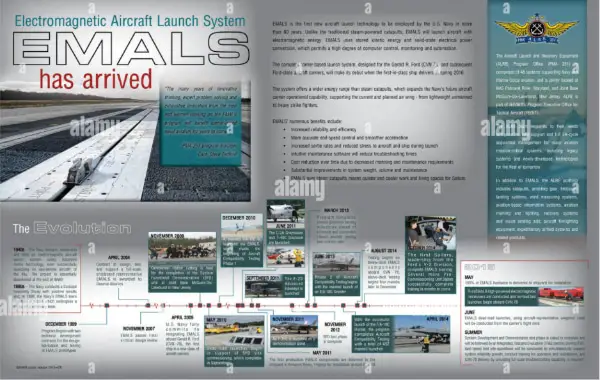
Designers take photographs from the event and paste them on the timeline as shown in the stock image. The photography can bring to the memory of the reader a specific event, and he will be better at connecting the dots along with your infographics timeline. You can select standard colors that ad a flavor sober to the taste of your news. Sans serif fonts for body text and Display fonts in the header go perfectly well on such timeline infographics.
14. Thin Flat Website Header Banner Timeline
As we mentioned at the beginning of this blog, businesses put together timeline infographics related to their startup journey. Hence, we bring you a suitable match for designers to create artistic business timeline infographics.
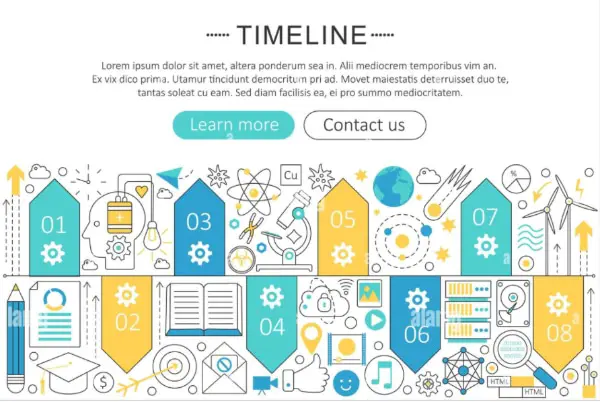
Whether it is the services a business provides, business milestones, or a roadmap to the future, you can use the above stock image for all purposes. Moreover, yellow, blue, and sea green are the most prevalent colors used in timeline infographics. Hence, designers can use this combination freely and confidently in their designs.
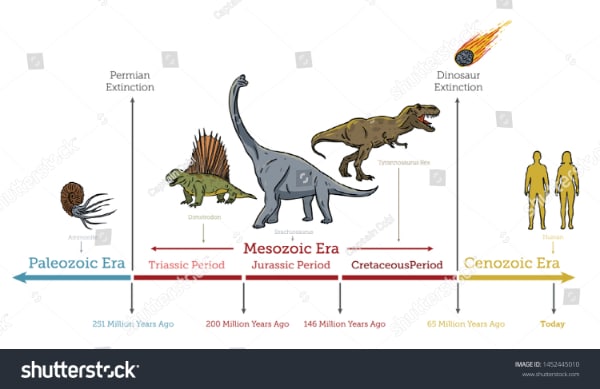
15. A Timeline of Dinosaurs Extinction for Educational Purposes
Timeline infographics are most useful for the education sector, precisely for history and grammar classes. Designers can make use of cartoons and illustrations to put on a timeline. The target audience for this section is primarily children, and hence using illustrations will attract their attention. You can take inspiration from our stock image specimen for timeline infographics for this purpose.
Using An Existing Timeline Infographic vs. Starting From Scratch
There are many benefits of using an existing timeline infographic, such as the 15 we’ve chosen below, over starting from scratch with a blank slate. Here are just 5 reasons:
- If You’re In A Hurry & Time is Of The Essence
- Royalty-free & No Pressure To Make A Quick Purchase
- Professionally Designed by Experienced Graphic Designers
- No Need To Try And Come Up With Design Elements & Ideas
- Simply alter the text to what you need it to be and you’re ready to publish.
Timeline Ideas For Creating Captivating Infographics
Many people enjoy visuals such as images and videos and to keep a reader’s attention, it’s important to have engaging and interesting infographics that are captivating long enough for the reader to clearly understand your message or timeline of events.
If you are needing some inspiration and are not exactly sure how to use your timeline infographic, here are some ideas:
- Financial and economic events: Example: Designers can illustrate historical financial market events, inflation, interest rates, etc.
- Change in medical condition: Example: A lively, or animated infographic displayed by medical professionals showing patient conditions going from bad to great.
- Evolution of current news: Designers can prepare a timeline infographic on the evolution of current affairs in local and international communities.
- Comparative table of two famous personalities: You can use timeline infographics to show career graphs of two professional athletes.
- Comparative study of economic parameters of two regions: Example: Infographics of a map that shows the standard of living index in different geographical areas.
- Social media timeline infographic to promote a brand: Example: This could be as simple as showing when you only had 5 subscribers up to your current 5 million.
- A short video on how the brand evolved over the years. Example: Use a timeline infographic within your video adding narration and other captivating elements.
- Educational growth content through infographics: Example: Teachers can display student learning benchmarks through timeline charts.
As you can see, there are numerous ways to use timeline infographics with many professional-looking and high-quality ones available on premium stock asset websites (see below), that can be downloaded immediately.
Be cautious of low-quality designs available on many free image and vector platforms. Additionally, some authors require recognition of their infographics with publication. In other words, royalty-free timeline infographics are your best option, but the quality is important too.
Free Online Infographic Tool
Did you know that you can simply use an online application to create your infographics, and for free? If you want the option of creating any type of infographic using another graphic design tool, other than what you’re currently using, here’s the solution.
- Templates Available: Yes
- Use Your Own: Yes
- Start From Scratch: Yes
This can be a time saver if you have high-quality templates to start with such as those listed below. However, if you’re ready to get started creating, here’s the best free online infographic tool we found that comes with free templates like this one we made in about 20 minutes.
This free resource is provided by the world-renowned web and graphic design company, Adobe, and their Creative Cloud Express.
Conclusion
Infographics simplify lengthy data sets into short info capsules. It provides readers with a guided experience to quickly understand complex information and create an understanding of the subject. For instance, masks and sanitizers marked on a specific month on a covid-19 timeline help readers relate and connect dots on the issue quickly.
Additionally, optimizing page space through infographics becomes convenient, sparing time and money for the publication. Hence, having a timeline infographic can prove to be a helpful tool for content generation.