Line25 is reader supported. At no cost to you a commission from sponsors may be earned when a purchase is made via links on the site. Learn more
Have you ever wondered how often people use apps like Instagram? And of those people, how many actually share their photos on this app? Or have you asked yourself what are the most and least explored places in the world and what’s different and surprising about these places? Infographics present this information and more in a clear, fun, and animated way, and anybody can create them, whether you have a background in design or you’re a beginner. By using a variety of fonts, typography, charts, and graphics, you can create a one-of-a-kind infographic on a topic that interests you and share it with everyone else. It’s a fun and relatively simple project that you can work on in your free time, to practice some basic elements of design or share something of interest with your coworkers, friends, or a greater audience.
An infographic is practically a collage of information related to a specific topic that shows concrete evidence of what you’re trying to explain. As opposed to a basic bar or pie chart, infographics use a unique combination of elements, like different font types and images, (and sometimes including, but not being limited to, bar or pie charts) to explain different topics of interest in greater depth for others to gain a deeper understanding on the topic and to better remember the details later on.
Nowadays, it’s critical that you learn how to turn data into visual experiences in order to create a story that focuses on the facts and eliminates the clutter of confusing and often redundant information. Whether you’re in marketing or PR, content development and interpreting and presenting data takes up a big part of your content, and infographics are the way to go. They are visually pleasing and designed in a way that makes complex topics easy to understand whether you’re a bigger or an expert on the topic, especially topics that are inherently visual.
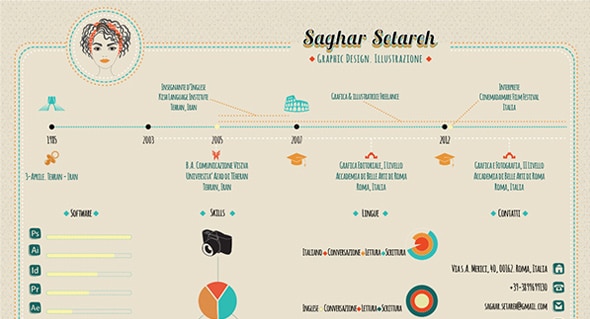
So here you have them, 40 data visualization projects for your inspiration. This article includes both excellent examples of infographics as well as vector elements that will help you better design an infographic. Additionally, there’s a fantastic example of how you can use infographics for more than just presenting external information; you can actually use it to describe yourself, and the things you do best. We’ve shared with you an absolutely wonderful example of a CV + mini portfolio infographic that presents a selection of graphic design, illustration, and drawing work, which was created using Adobe Illustrator and Photoshop. Take a glance and be inspired, and let us know which one of these infographics stood out the most to you!
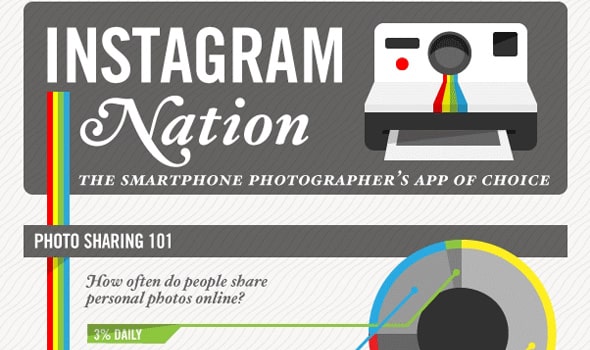
Infographic: The Explosive Growth of Instagram!
UW Design Show 2011 | Kelsey Cole
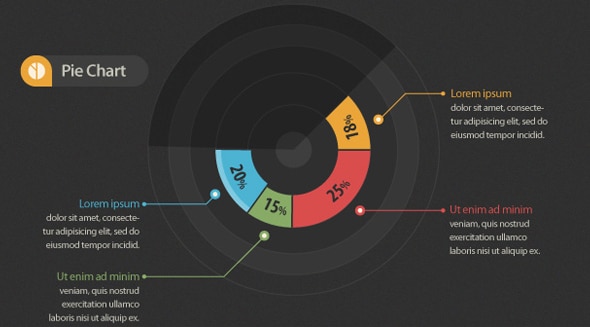
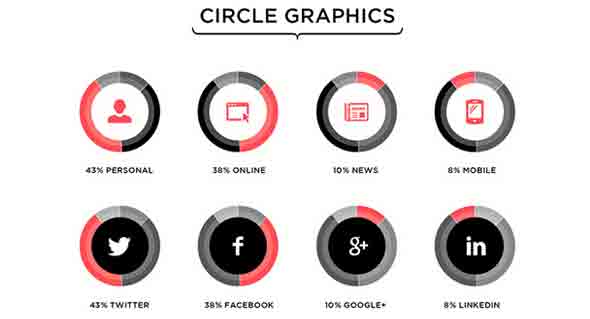
Infographic Vector Elements
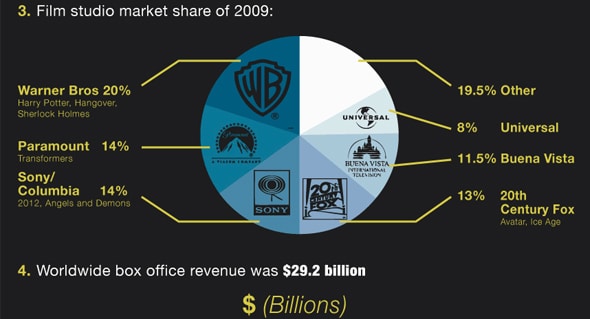
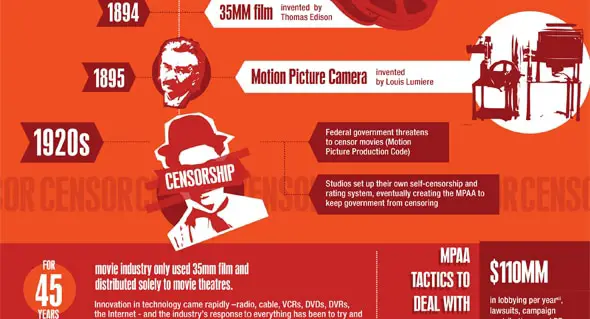
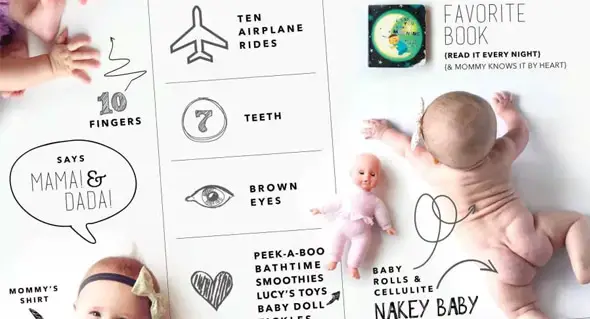
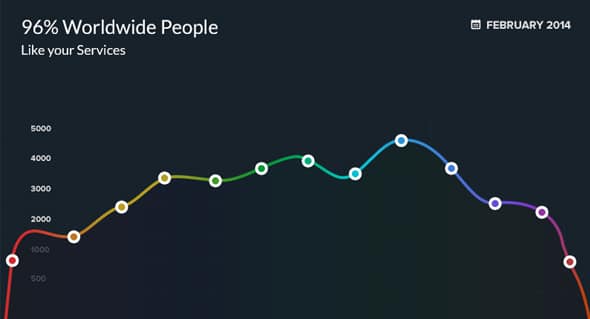
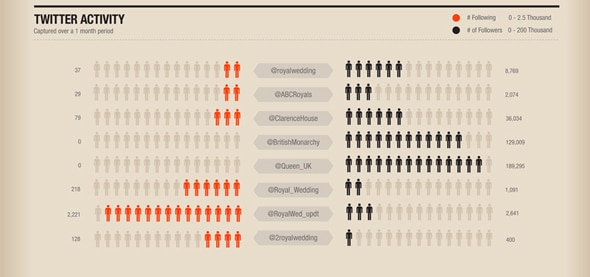
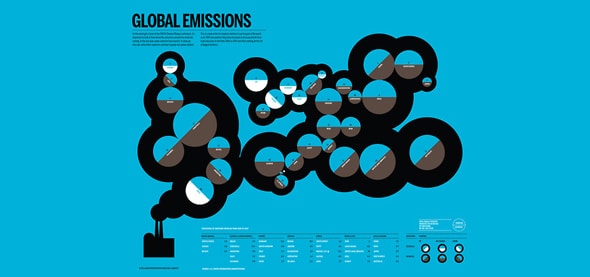
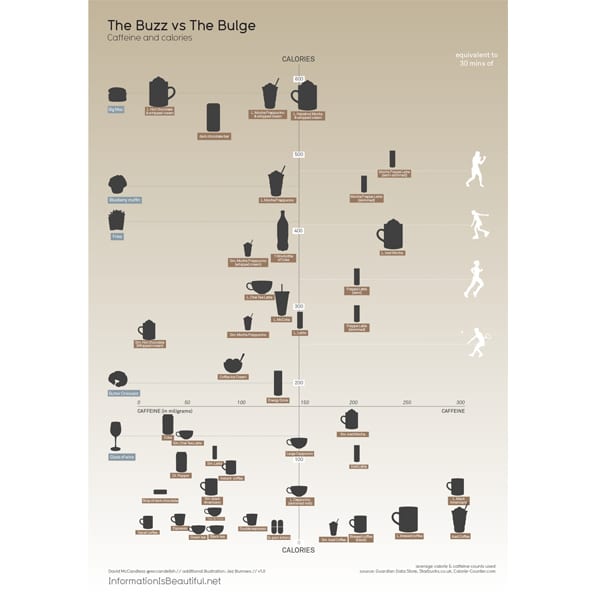
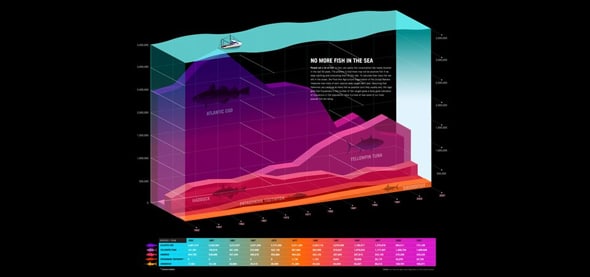
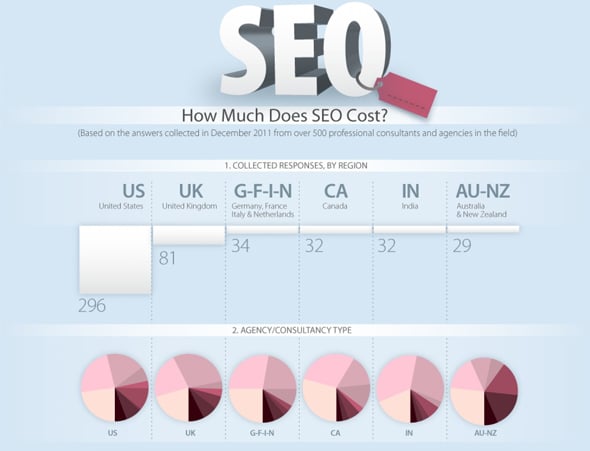
Best infographics data vizualisation
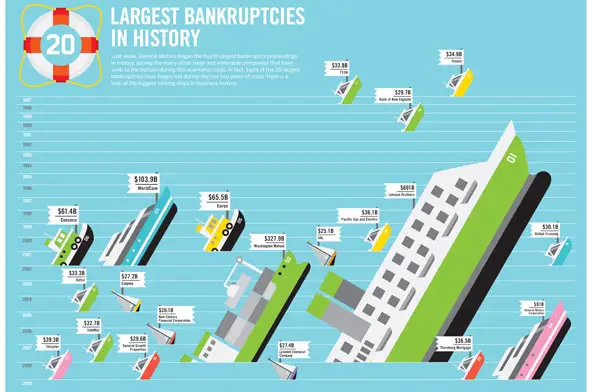
The largest bankruptcies in history
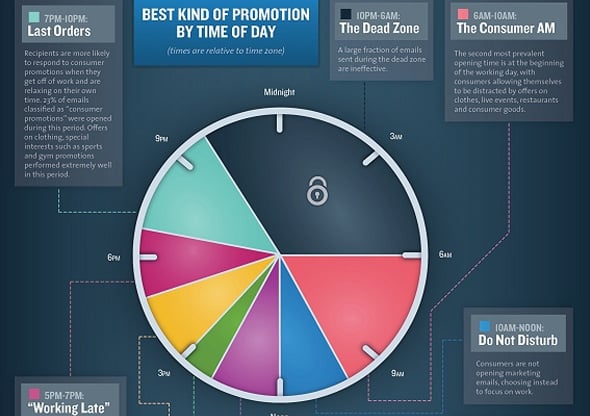
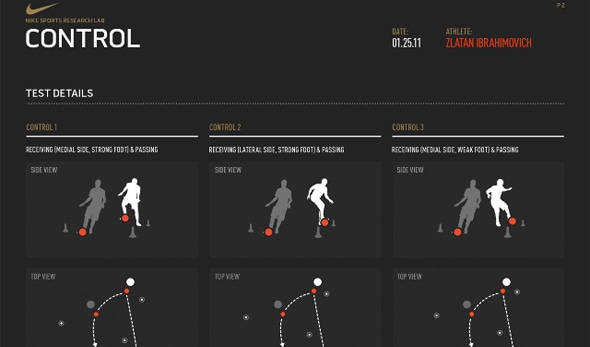
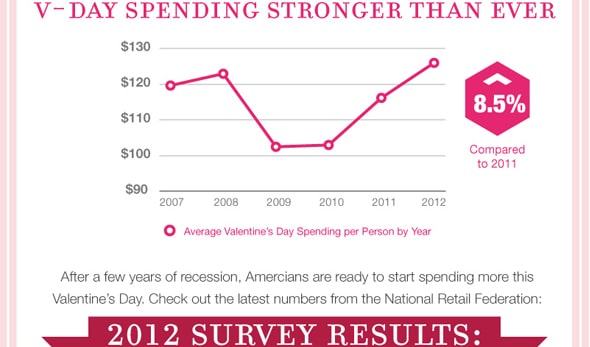
The Science of Social Timing Part 2
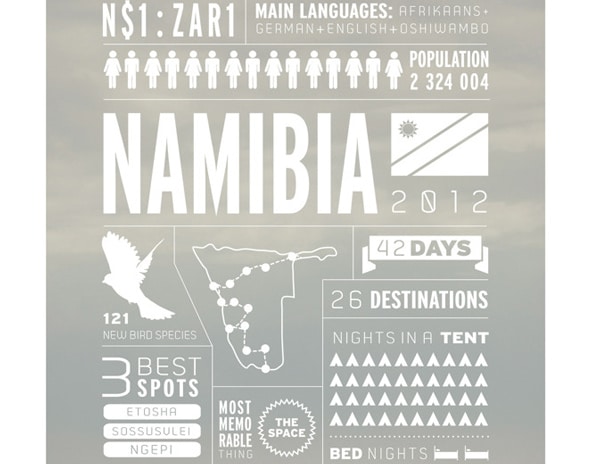
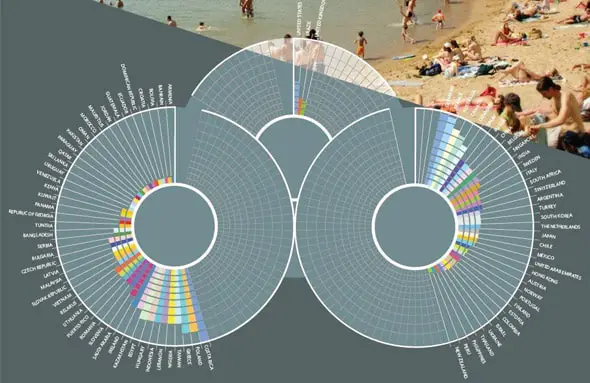
Southern Africa travel infographics
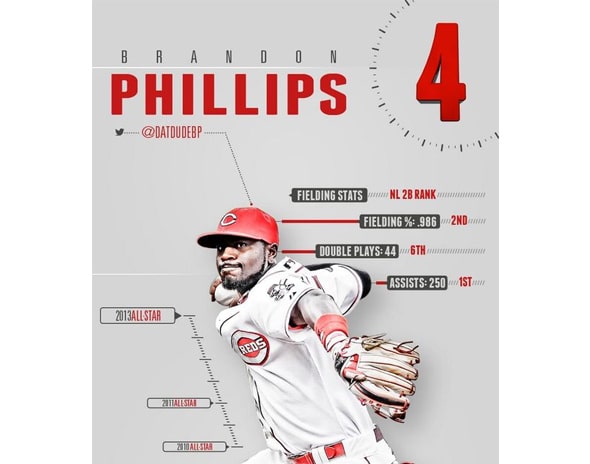
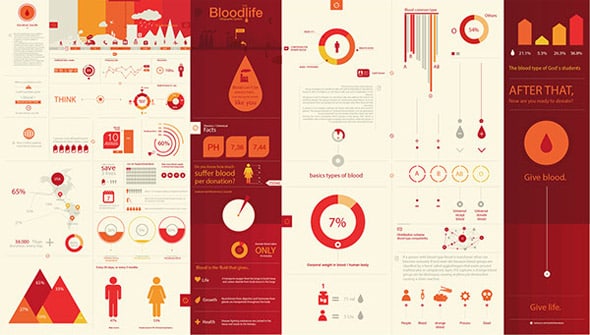
#RedsInfographics series
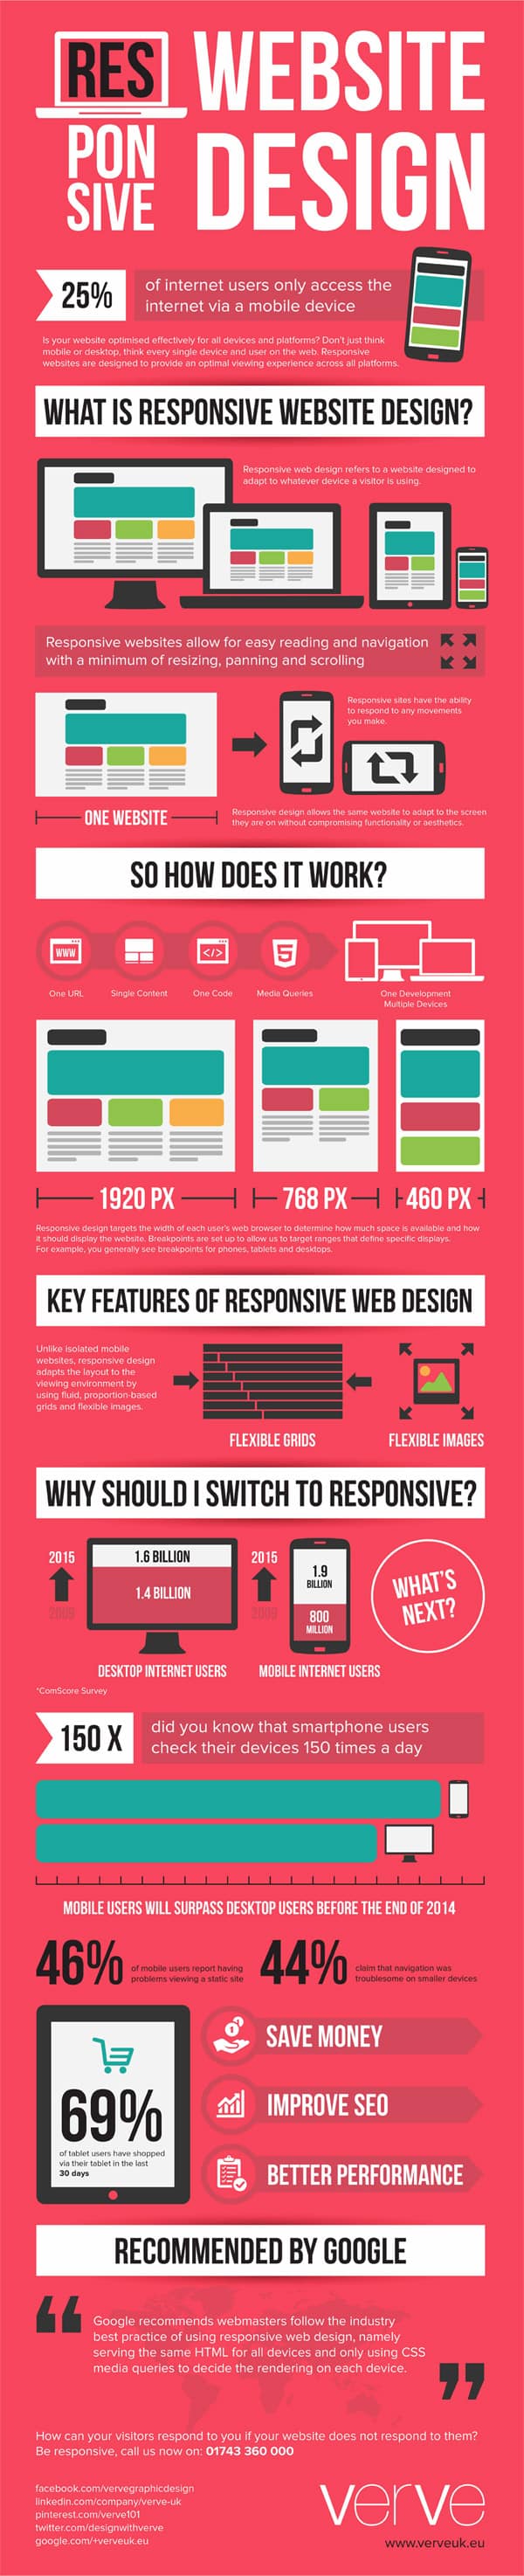
What is Responsive Website Design by Verve
Shopify 2015 Annual Report
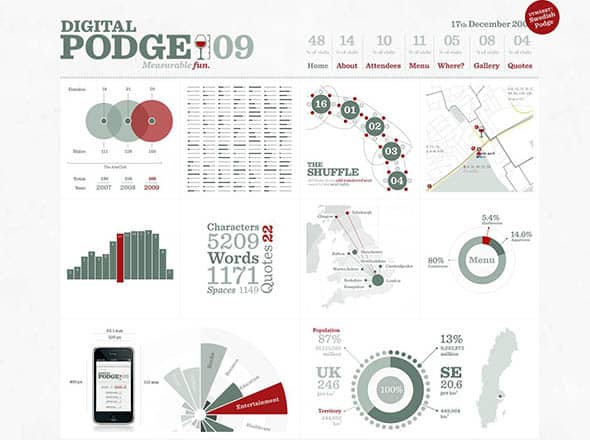
Digital Podge
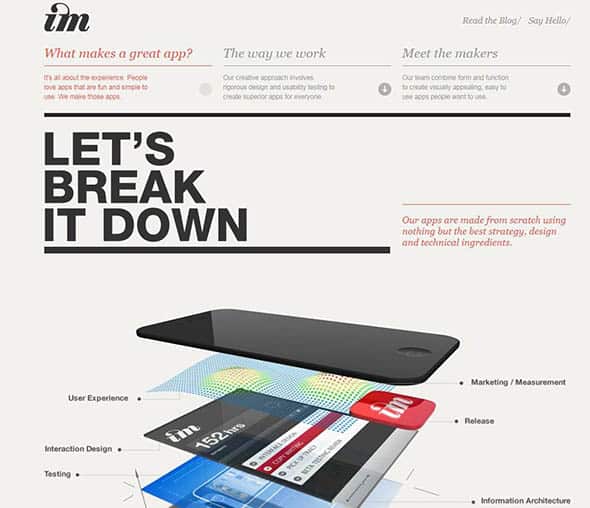
Imagemechanics.com.au
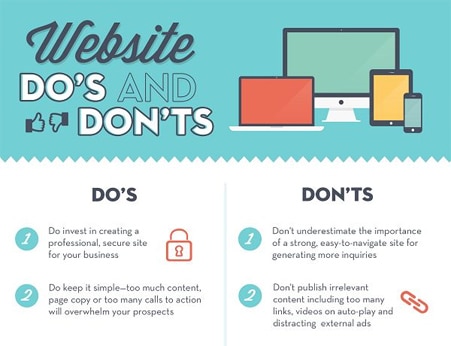
20 website dos and don’ts
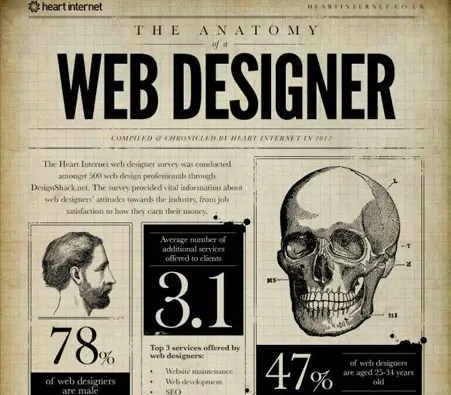
The anatomy of a web designer infographic
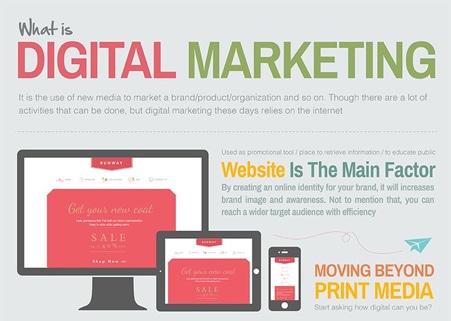
Digital Marketing 101
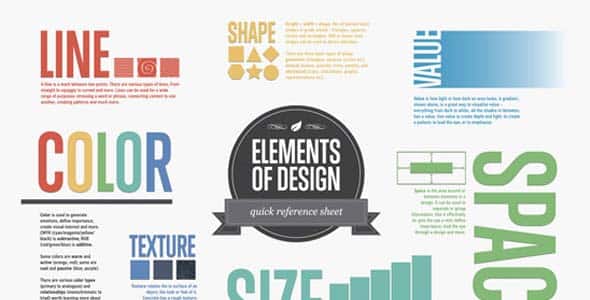
Elements of Design
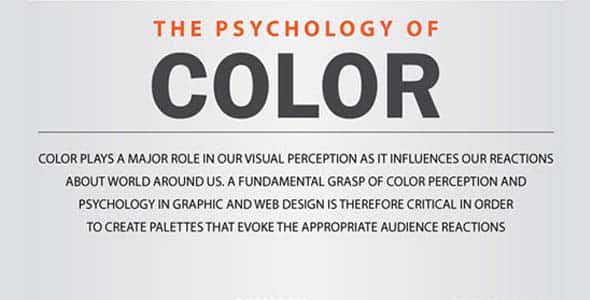
The Psychology of Color
![YouTube-The-Secret-Ingredient-for-Job-Recruitment-[INFOGRAPHIC]](https://line25.com/l25-02-2023/wp-content/uploads/2016/03/YouTube-The-Secret-Ingredient-for-Job-Recruitment-INFOGRAPHIC.jpg)

![The-Growth-of-Mobile-Is-Driving-Cloud-Computing-[Infographic]](https://line25.com/l25-02-2023/wp-content/uploads/2016/03/The-Growth-of-Mobile-Is-Driving-Cloud-Computing-Infographic.jpg)


Just wrote an article regarding infographics and their worth in regards to web design. This collection is great, will bookmark some of these.
Awesome collection, each infographics has unique feature, I loved all of them. In online people wants read the information in a minimal time regarding this infographics are very helpful to convey the information to the users. The different type business need different type of graphics, the above post gives clear idea to develop infographics for various businesses.
Thank you sharing