Line25 is reader supported. At no cost to you a commission from sponsors may be earned when a purchase is made via links on the site. Learn more
Managing content assets is a strenuous task. Whether it is social media or some blog, they have numerous sources of extensive data. And managing them simultaneously can be burdensome.
Data is used for numerous reasons. Many businesses use the information to stand out from the competition. It is essential to present that same data the correct way.
Many stakeholders have trouble understanding or paying attention to boring presentations.
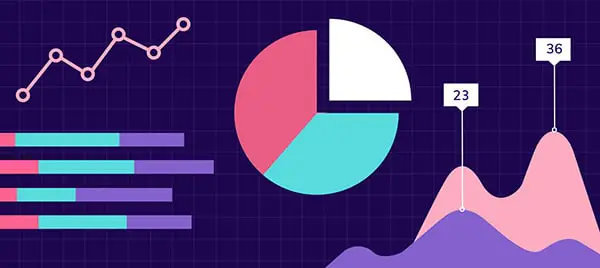
That is why it’s vital to visualize your information. Data design is significant since we’re wired to be naturally drawn to images. Graphs and charts are unique tools at helping us with data visualization.
But you can’t put on a couple of graphs and charts and call it quits. There is a right and wrong way to use them. For your luck, you can do a couple of things to enhance and improve your presentations.
Here’s a compilation of tips and tricks on how to beautify and enrich your data showing!
1. Visually appealing features for adequate data exhibition
Because of their broad use, charts and graphs come in all kinds of designs. You have to choose the right map for your data. You should choose one that is going to make your data easy to comprehend. Not only that, but it should also capture your audience’s attention.
When choosing a graph or a chart, first think about the information you are trying to present. Then, think about the types of people the data is getting across.
2. Choosing the right type of chart
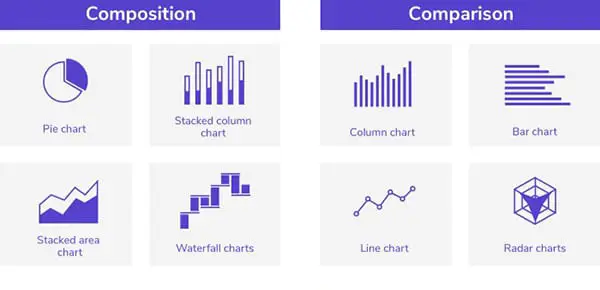
It is vital to make sure you have put your data in an acceptable format. Use bars, pies, and charts with lines to divulge into different stories. Ensure your data is portrayed in the optimal design.
Make the data in chronological order. Make sure the data is understandable.
Once you’re done, remove anything unnecessary.
Make the chart is easy to follow. Make the design visible and engaging.
3. Avoid mixing different chart types
If you have numerous data you want to show through the presentation, you might have to keep several things in your mind.
First, don’t cram the data. Resist packing your charts. If it’s necessary, add another chart.
If you put two different data types in your chart, both users and the audience will get confused.
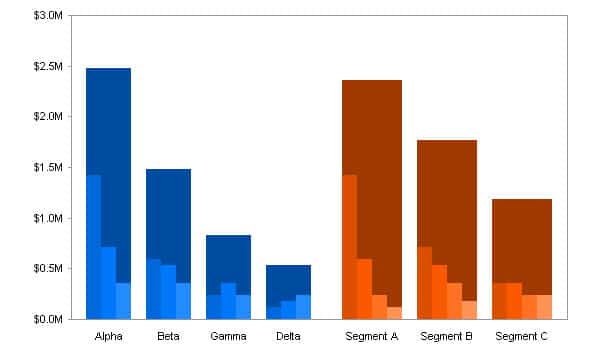
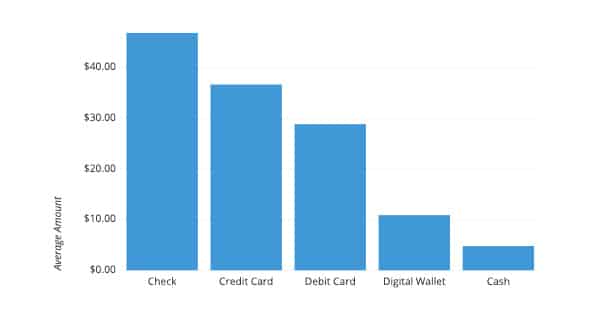
4. Using the right direction
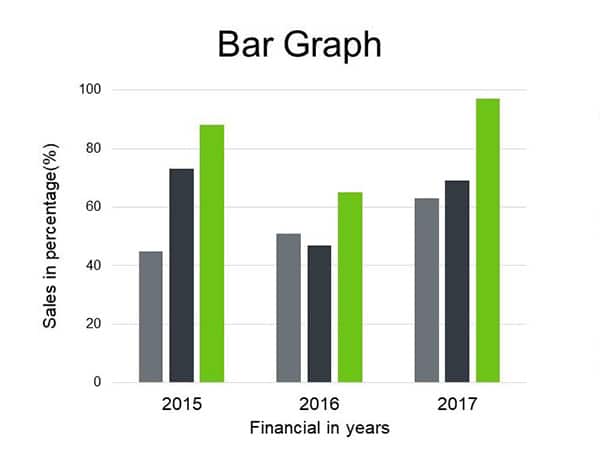
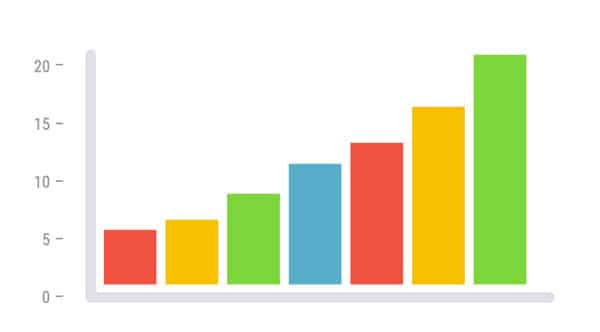
Another standard tool for showing data in presentations is bars. They come in both horizontal and vertical axes. If you want to show chronological data, opt for vertical bar charts. If you have wordy labels, a horizontal one is what you should be going for.
5. Be careful of your placement
You might have two charts which are comparing data. You shouldn’t place them close to each other if you’re trying to do that. But don’t remember them too far apart. If you do so, many of the viewers will have a more challenging time getting the message.
That shouldn’t happen. The chart should make the whole presentation and the data more comfortable to read.
6. Avoid using 3D effects
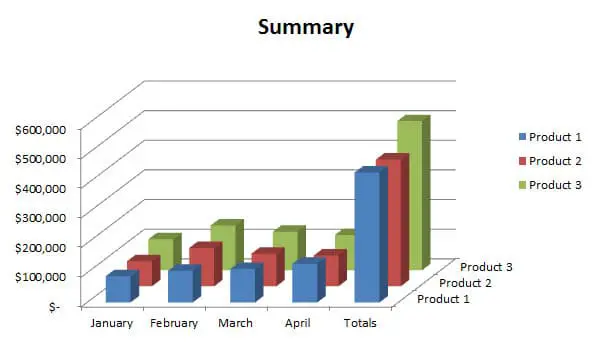
Another common mistake people make is adding too many details to the chart. They will add all kinds of effects on their bars and graphs. This is a big no. The dramatic results will only make the data harder to read. It will be an eyesore to the viewers and will divert their attention.
7. Clean the presentation by organizing it
It is crucial to have your data charts coherent with the rest of the presentation. Choose a design that is pleasant to the eye. It shouldn’t divert the attention from the information you’re trying to present. A simple, minimalistic design is more than enough. It will deliver your point straight across with minimal effort. It’s always better to have a clean website rather than a cluttered one.
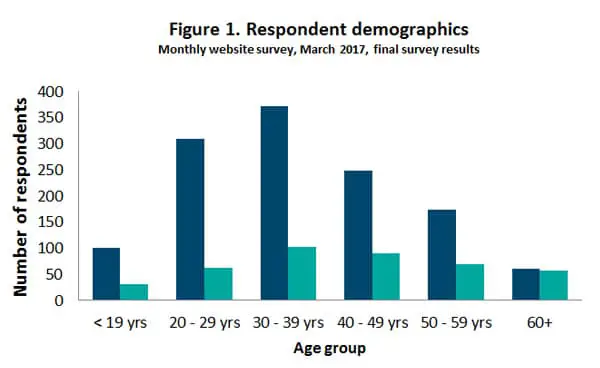
8. Adding titles and a source line
When you’re making charts and graphs, make sure you understand the reasons behind their use. They are here to simplify your information. They’re often left off. This cannot be very clear.
Add a title and other crucial information that is needed for understanding the graph. But, the labels should get straight to the point but be descriptive at the same time. Also, do not forget to add sources. This will make your data more credible.
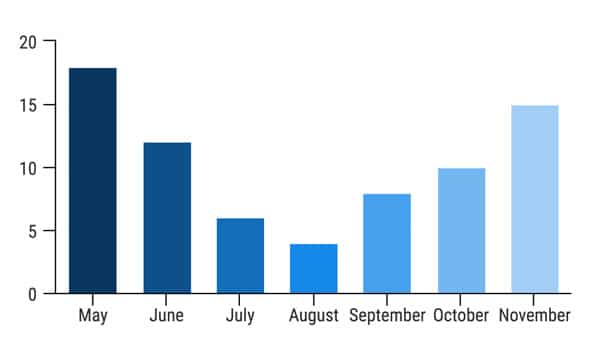
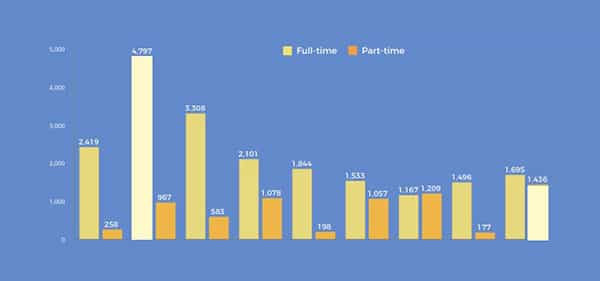
9. Keep track of the bar widths
Make your bars equal in width. They shouldn’t differ from the rest. If they do so, they might be confusing to the viewer. They also can ruin the whole point you’re trying to make. Avoid distractions by pushing them apart by half the size the bars are.
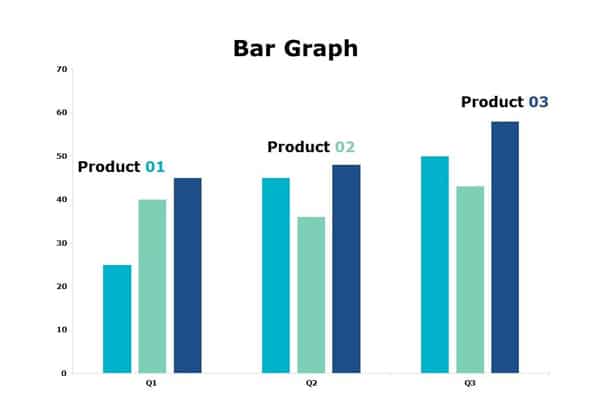
10. Use color cues for faster storytelling
Another essential element you should pay attention to is color. Color speaks when words can’t. But, it should be used with great care. Keep the colors simple and harmonious. Use color only when it is necessary. That means that you should use color to highlight critical information.
If you add too many colors, it will cause the presentation to be messy. But avoid using the same color everywhere. It will be monotonous and will cause the data to evaporate from the highlights.
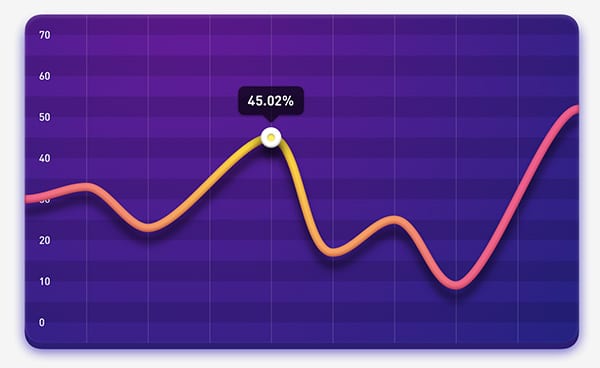
11. Avoid using grid lines
The best thing you could do to improve your presentation is by avoiding grid lines. They can be distracting and will make your presentation look amateur. If you want your audience to see the bigger picture, make sure there are no grids.
12. Keep away from the general connotations the positive and negative numbers have
If you have data showing on bars and graphs, avoid mixing colors with the message you’re trying to present. If you have both positive and negative numbers, don’t use their contrasting colors. What we mean by that is do not use green for negative numbers and red for positive.
This will only be conflicting to the viewers. Since we have the opposite association with these colors and the kinds of numbers they’re representing, the meaning of the data you’re trying to give will be conflicting.
13. The design should improve the data’s comprehension
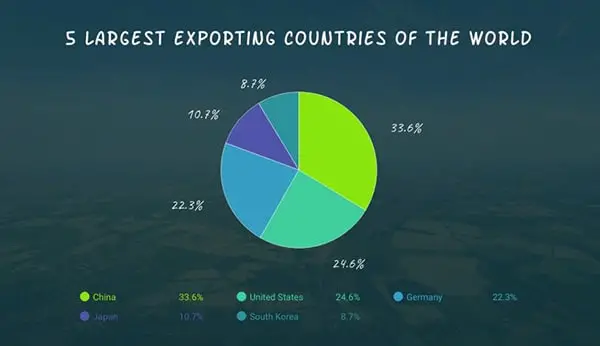
You do not want to make your data chart or graph crammed with unimportant elements. After you’re done, take a moment to check everything once again. There might be some details that ruin the chart or make it difficult to follow and understand. Use no more than six pie chart slices. This will keep it simple. It is subtle, but it will make an enormous difference.
14. Get rid of unnecessary graph backgrounds
Many graphs come with previously designed backgrounds. Lines or grids are often not required if you’re presenting simple points. By removing them, you’ll help people focus on the thing you’re trying to explain. Overall, graphs are meant to compare complex data simply. Remove these unnecessary things and use the general graph design: the less, the more.
15. Use simple fonts and visual elements

If you want to focus on a particular point or part, keep it simple. The best way to highlight the critical aspects is to use bold or italic text. That way, you’ll subtly emphasize the message. But, use one at a time. Don’t use them simultaneously.
16. Be careful when applying text
The text you choose can have a significant impact on chart visualization. Be mindful of what kind of writing you’re using, and be careful how much of it you’re using. Sometimes too much of the writing can be distracting.
This can ruin the presentation’s overall look, especially if the same work isn’t nicely organized. Once the site is too cramped, nothing else you can do to improve the production.
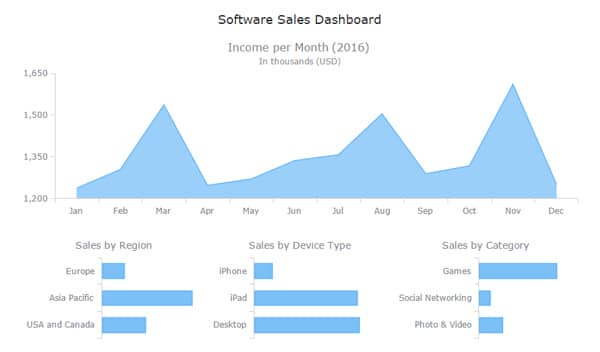
First, the most important text should be placed at the top. That is the area that the eye is first drawn to. Then, limit the number of views in your visualization to three or four. If you add too many, the big picture is lost in that.
Addition to Point 13: «This will keep it simple. It is subtle, but it will make an enormous difference.» Avoid fonts like Comic Sans or similar and apart from that donʼt use only upper cases.